Guide
Budgets
Budgets per category or category type, on daily-to-annual cycles or a custom month-by-month plan, with a budget-vs-actual report.
Bluecoins budgets are per category or per category type. Each budget is one amount plus a cycle — the app calls it the frequency — and Bluecoins converts that amount to whatever period you are viewing, so a weekly budget and a quarterly budget can be read side by side. Budgets live in the Categories feature: Budget setup for the amounts, Budget report for budget-vs-actual, plus a per-category daily report.
Setting a budget
You can budget at two levels, and they are mutually exclusive:
- Per category — the limit belongs to one category (Groceries, Fuel, Movies).
- Per category type — one shared limit for a category type and all the categories under it, for example Food covering Breakfast, Lunch, Dinner, and Snacks.
Enabling one level turns the other off for that branch. Switching on a group disables the budgets of its categories; switching on a category disables its group’s budget. The tree always shows exactly one active budget per branch, so nothing is counted twice.
In Budget setup every category type, category, and sub-category is a row with an enable switch and an amount. Set the amount by tapping it, and change the cycle from the frequency picker on the row. The screen has separate Expense and Income tabs, so income categories can carry targets too.
Budget frequencies
Every budget stores an amount for its own cycle. The cycles offered in the app are:
- Daily
- Weekly
- Every 2 weeks
- Every 4 weeks
- Semi-Monthly (twice a month)
- Monthly
- Monthly – Custom — a different amount for each calendar month (January 100, February 120, March 130, …)
- Every 2 months
- Quarterly
- Semi-Annual
- Annually
A different budget per week, month, or quarter is just a matter of picking a cycle. For month-by-month variation, choose Monthly – Custom and enter the amount for each month.
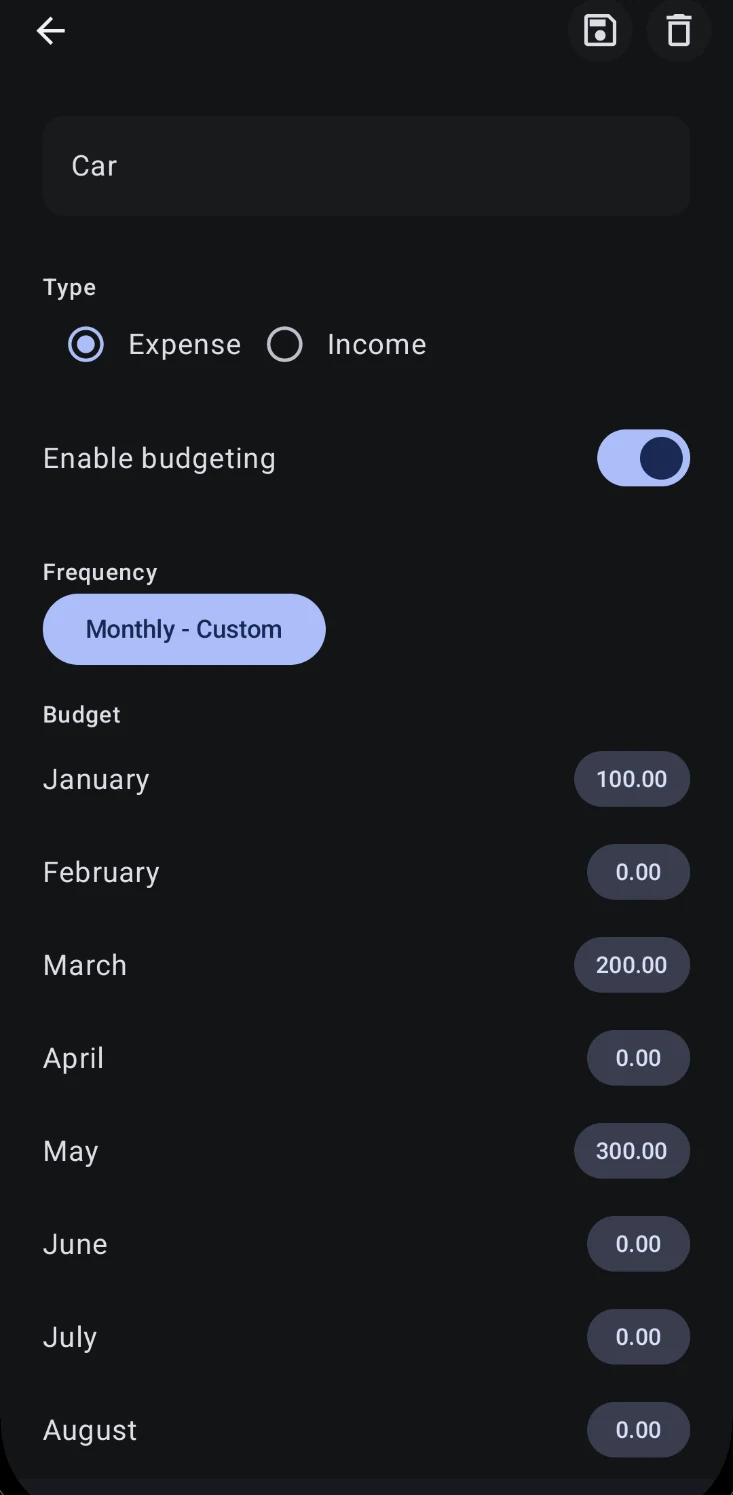
Reading budgets over your own time-frame
Each budget is stored for its own cycle, so budgets with different cycles can be read over one shared period. Budget setup has a frequency selector in its top row that sets the cycle used for the overall group total, while each row keeps showing its own budget amount. The budget report has a full date-range picker — Today, This week, This month, This quarter, This year, the Last… options, and custom start and end dates.
To make different cycles line up, Bluecoins converts each budget to the selected period:
- a weekly budget reads as roughly ×4.35 for a month, ×13 for a quarter, and ×52 for a year;
- a quarterly budget reads as ÷3 for a month and ×4 for a year;
- an annual budget reads as ÷12 for a month.
The conversion uses fixed ratios (52 weeks, 12 months, 4 quarters, 365 days), so a “month” in a budget report is one twelfth of a year. To compare periods, widen the date range: pick a multi-month or custom range and the report recomputes every category’s budget for exactly that window.
What a budget is not: no carry-over
Bluecoins budgets are not envelope budgets. A budget does not accumulate, and you cannot move an unspent (or overspent) balance from one period into the next, nor from one category to another. Every period is measured against its own budget.
If you want to see whether a lean month covers a heavier one, do it with the date range: select a range that spans both months (for example, 1 May to 30 June) and the report shows actual spending against the combined budget for that window. This is deliberate — Bluecoins is a reporting budgeter, not an envelope app.
The budget report
The budget report is the budget-vs-actual view, with two tabs:
- Chart — a pie of actual spending per category (or per category type); select a slice to see its actual and its budget.
- Table — one row per category or group with the budget, the actual, the percentage used, and a progress bar. The bar also marks where today falls in the period, so you can see at a glance whether spending is ahead of or behind the pace of the period.
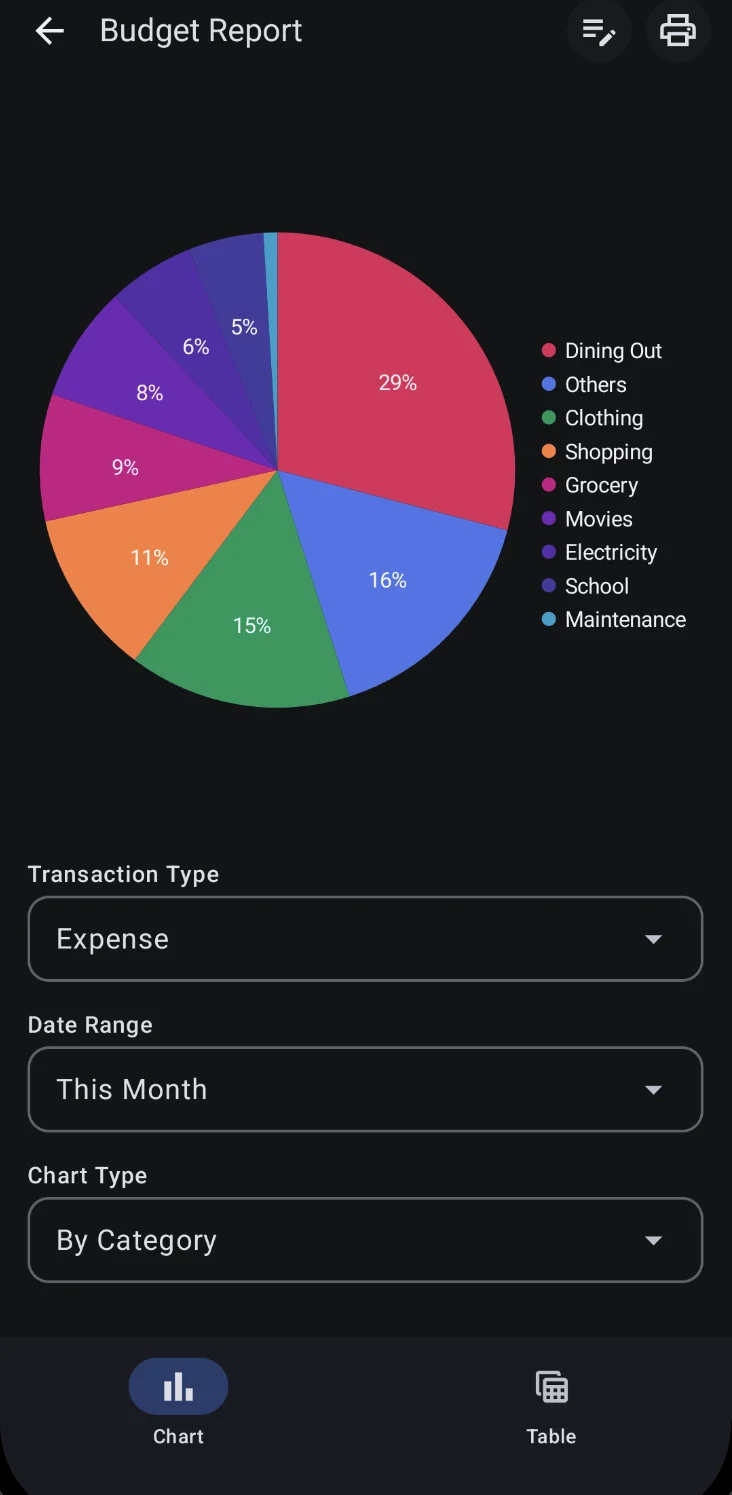
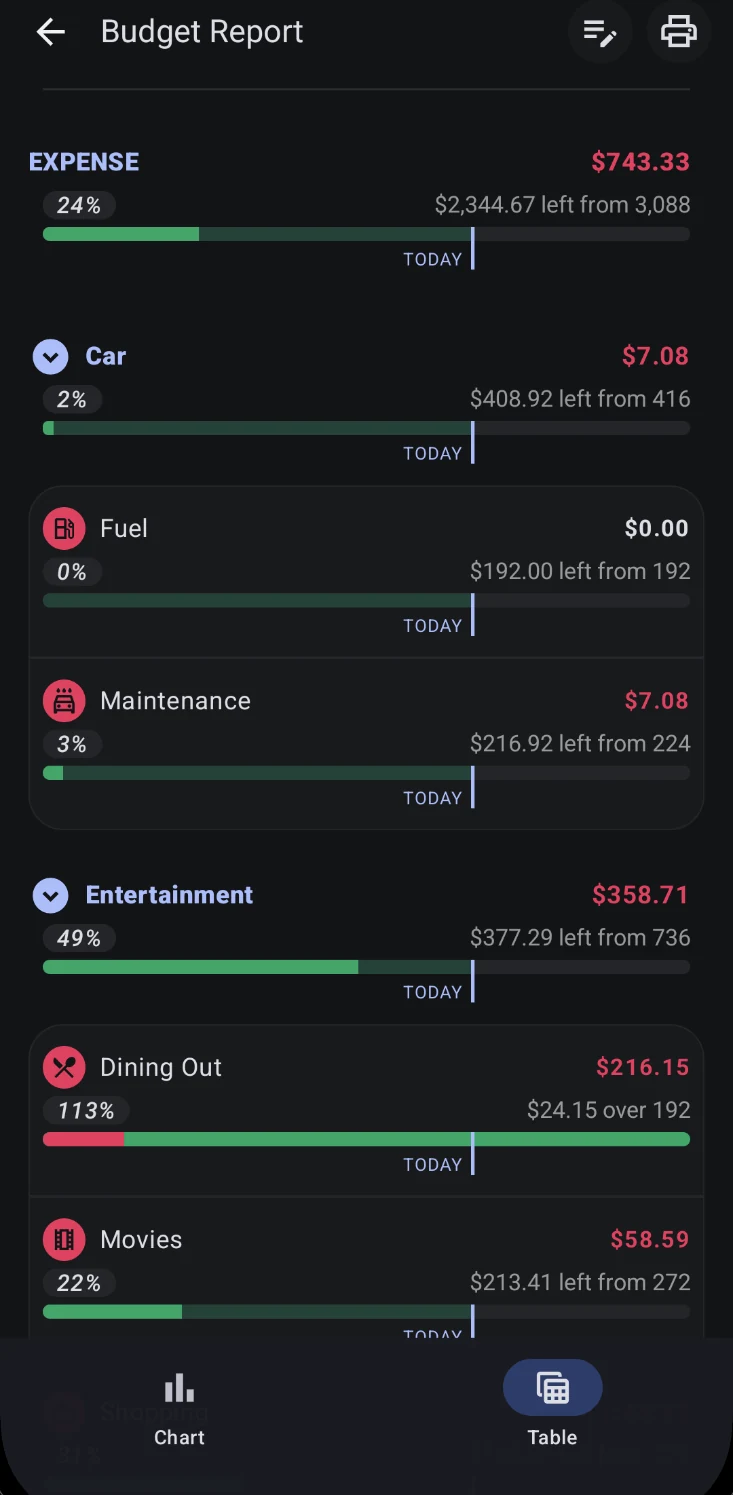
The report respects the filter dialog (accounts, labels, status, amount, and search), and rows are tappable: tapping a category, parent, or group opens the matching transactions for the selected period. The same screen can export to PDF, Excel, or HTML, or print. Exporting needs Premium.
Per-category daily report
Each category also has a daily report that breaks spending down day by day over a range you pick, with a summary-stats tab — useful for “how much did I spend on food this week, day by day?” without exporting anything.
Where to find budgets in the app
- Budget setup — enable toggles, amounts, and cycles for every category and group (expense and income).
- Budget report — chart and table budget-vs-actual, with drill-down into transactions.
- Daily report / Daily stats — per-day breakdown for a single category.
- Budget home tab — an optional dashboard tab that shows budget progress.
Because budgets are per category (or per group), the place to start is the categories list: open the category or group you want to control, set its budget, then let the report show you how actual spending lines up against it.